One of the most intriguing aspects of the Tour de France, beyond the dazzling victories and dramatic rivalries, is the evolution of the race’s average speed. Throughout its history, a multitude of factors have contributed to significant changes in the pace of the peloton, from technological advancements to race strategies. Let’s embark on a journey through the annals of the Tour to examine this transformation.
The early editions
The early years of the Tour de France were characterised by lengthy stages often exceeding 400 km, rudimentary bicycles, and rugged roads, which resulted in a slow pace compared to today’s standards. Maurice Garin, the winner of the first Tour in 1903, achieved an average speed of 25.7 km/h, or approximately 16 mph. This may seem leisurely in the modern era, but given the conditions at the time, it was an impressive feat.
From these humble beginnings, the Tour’s average speed gradually increased as a result of several key factors. First and foremost, technological advancements played a significant role. Innovations such as derailleur gears, lighter frames made from aluminium or carbon fibre, aerodynamic clothing, and improvements in nutrition and training regimes all contributed to an upward trend in the peloton’s pace.
Fastest editions of the Tour de France
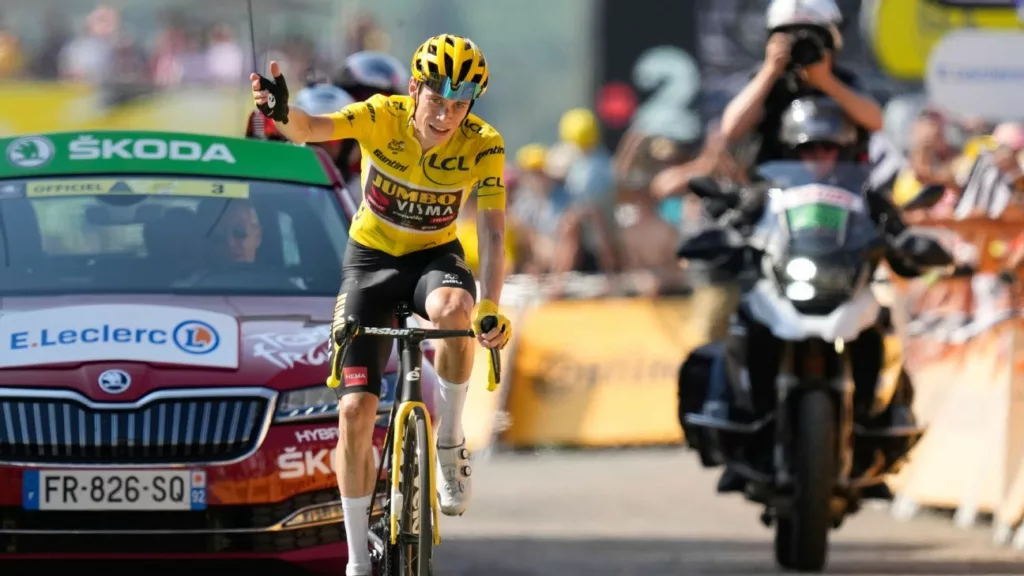
Among the fastest five editions of the Tour de France, the 2005 edition holds the record, with an astonishing average speed of 41.7 km/h, or approximately 25.9 mph, achieved by Lance Armstrong. However, it’s worth noting that Armstrong was later stripped of his titles due to doping. 2003, 2015, 2017, and 2019 Tours are also among the fastest, with average speeds ranging from 40.7 km/h (25.3 mph) to 40.9 km/h (25.4 mph). 2022’s Tour de France, won by Jonas Vingegaard, saw a new record set with an average speed of 42.03 km/h (26.1mph). That’s now a jump in the Tour de France average mph of 10mph since the inaugural edition in 1903.
Slowest editions of the Tour de France
Contrastingly, the slowest Tours de France typically date back to the early 20th century, primarily due to the aforementioned factors of longer stages, simpler bicycles, and challenging road conditions. The five slowest Tours were the editions from 1919, 1922, 1923, 1924, and 1926, with average speeds ranging from 24.1 km/h (15 mph) to 24.3 km/h (15.1 mph).
How and why the average speed has changed over time
It’s crucial to mention that strategies have also evolved significantly, with modern cycling teams employing more sophisticated tactics, optimising rider roles, and using advanced data analysis to gain an edge. The increased professionalism in the sport has contributed to the upward trend in speed.
Looking forward, it’s exciting to contemplate what could further increase the Tour de France’s average speed. Advancements in bicycle technology continue at a rapid pace, with continuous improvements in weight, aerodynamics, and power transfer. Similarly, cutting-edge training techniques, informed by genetics and sophisticated performance data, will continue to enable cyclists to push the boundaries of human endurance and speed.
Furthermore, improvements in road surfaces, planning of race routes, and even changes in race rules could have an impact. For example, more downhill finishes could raise the overall average speed, although the safety of riders would always be paramount.
In conclusion, the evolution of speed in the Tour de France is a fascinating aspect of this iconic race. From the early Tours, characterised by their gruelling pace and hardy riders, to the high-speed, technology-driven spectacle of today, the race continues to captivate and surprise. As we look to the future, we can expect the boundaries of speed, just like the race itself, to be continuously challenged and redefined.